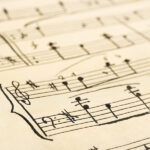
DO you like listening to…. – a musical representation of Data
This is my final piece for the challenge of Week 4. After looking into a report of a survey conducted by 16Personalities.com, where it analysed the tastes in music genres based on different personalities, I decided to visualise the data into a rather unconventional way. Sometimes idea do just pop into my head and explore the possible outcome and build on them. However, this time the idea generation process led to this.
The idea behind not making it clear on what the data means was in a way to reflect the idea of the meaning of ‘personality’ – one’s personality trait is not written on their forehead. One needs to get to know the person. But since the aim of this post is to explain my final piece, I will be explaining the artwork bit by bit.
The “Musical Data” Explained
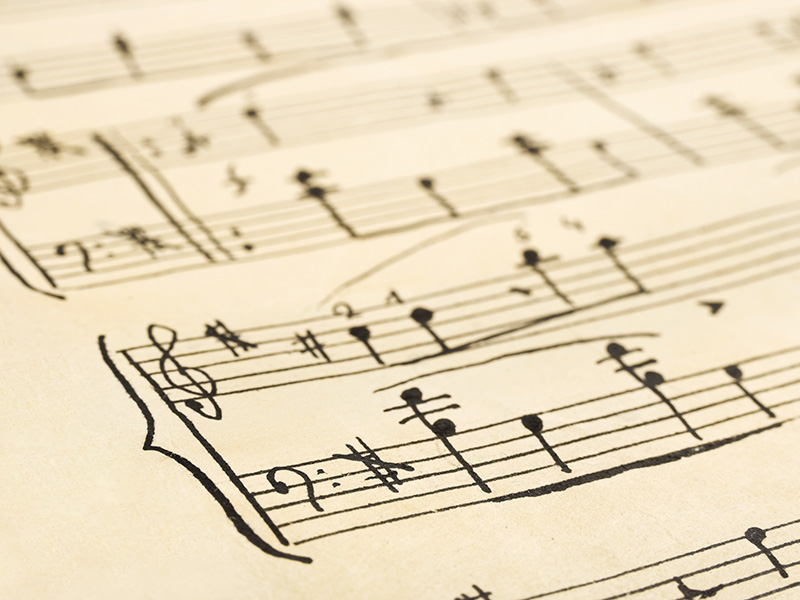
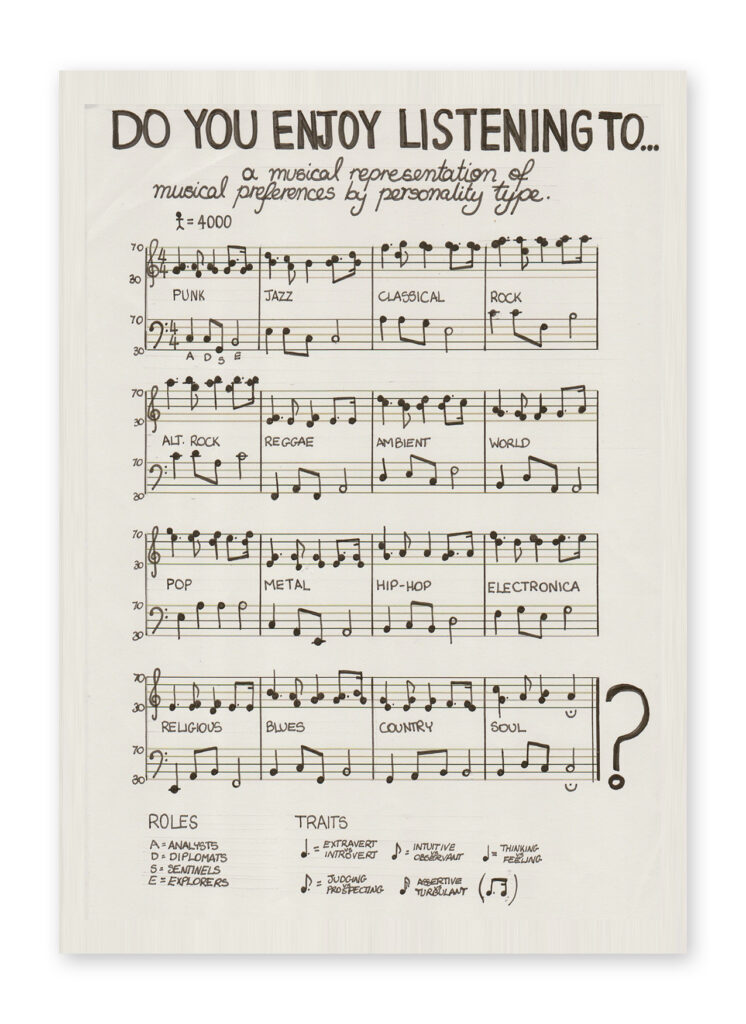
As one can see, the music is written in two clefs – treble and bass. In this case, the clefs represent two different data comparisons:
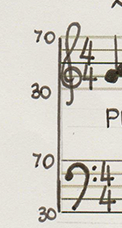
- Treble: Music genres preferences based on personality traits.
- Introverts vs Extroverts
- Intuitive vs Observant
- Thinking vs Feeling
- Judging vs Prospecting
- Assertive vs Turbulent
- Bass: Music genres preferences based on personality roles.
- Analysts
- Diplomats
- Sentinels
- Explorers
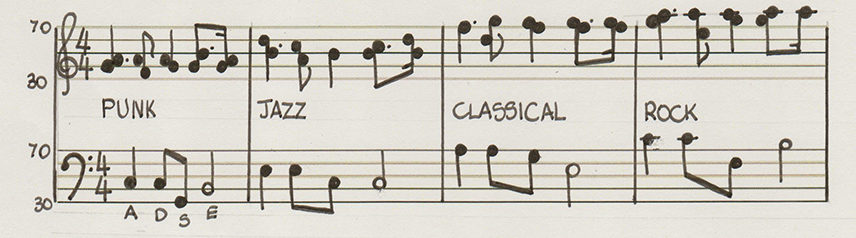
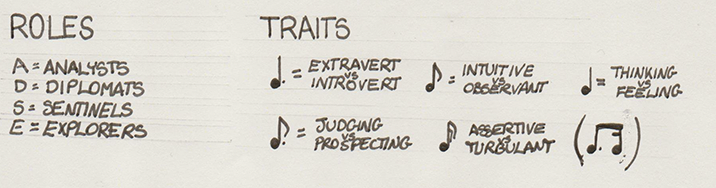
In addition, I used different notes to show roles and traits respectively.
Also, each line in the stave represents a 10% value. The staves show the values between 30% and 70%, whilst 0% to 30% and 70% till 100% are shown by the use of ledger lines.
Really enjoyed making this. I wen for the hand-drawn as opposed to digital as it makes is more personal. Digital can be a bit cold. Roll over week 5…